The levelized cost of electricity (LCOE) is the average cost of each unit of power a plant produces over its life, found by dividing all lifetime costs by all the energy generated. It lets planners compare solar, wind and gas on one scale.
For the wider picture, the renewable energy guide covers the main technologies and policies.
| Key fact | Detail |
|---|---|
| LCOE method compares plants | allows power plants with different generation |
| Lifetime costs vs energy | all costs incurred over lifetime |
| Identical discount rates | Many studies often use one rate, deviating from actual LCOE |
| Ground PV and onshore wind most cost-effective | Germany |
| CO2 price role | Plays a crucial role in the study’s cost results |
| Nuclear waste costs | Waste disposal and follow-up costs are not included in LCOE |
Figures from www.ise.fraunhofer.de; they can change, so check the source before you rely on them.
How the levelized cost of electricity is calculated
Fraunhofer ISE, the German research institute that publishes one of the most cited LCOE studies, describes the method as one that allows power plants with different generation and cost structures to be compared with each other. The calculation sets all costs incurred over the lifetime of the plant for construction and operation against the total amount of energy generated.
Future spending and output are discounted back to a shared reference date, so a euro paid in the last year of operation counts for less than a euro spent on construction. The same study notes that the calculation can be run with either the net present value method or the annuity method.
Four inputs drive the result for almost every plant type:
- Investment cost: the up-front price of equipment, grid connection and construction, spread across the plant’s lifetime.
- Operating cost: maintenance, insurance, land lease and, for thermal plants, fuel and carbon allowances.
- Energy yield: how much electricity the plant actually delivers, which for wind and solar depends on weather and site. The capacity factor of solar and wind plants is the usual shorthand for this.
- Cost of capital: the discount rate, which reflects how risky investors consider the technology.
Why the discount rate matters so much
Solar and wind plants spend most of their money before the first kilowatt-hour is sold, so the financing rate has a large effect on LCOE. Fraunhofer ISE points out that in many studies identical discount rates are often applied for all technologies and locations, which leads to deviations from the actual levelized cost. Its own study instead sets a rate for each technology from market-standard capital costs.
The International Energy Agency (IEA) and the OECD Nuclear Energy Agency take a different approach in their joint cost series: the 2020 edition reports plant-level LCOE at a real cost of capital cost and a corresponding discount rate of 7%. A common rate makes results comparable across countries, while technology-specific rates show how financing risk differs between, say, a rooftop array and a nuclear plant. Neither is wrong; they answer different questions, so a figure from one study should not be set beside a figure from another without checking the assumptions.
Solar, wind and gas compared
The 2024 Fraunhofer ISE study covers new plants in Germany. It finds that ground-mounted PV systems and onshore wind turbines are the most cost-effective technologies in Germany, among renewable energies and among all types of power plants. The table lists the ranges it reports.
| Technology (new plant, Germany, 2024) | LCOE range (€cents/kWh) |
|---|---|
| Ground-mounted PV, southern Germany | 4.1 to 5.0 |
| Ground-mounted PV, northern Germany | 5.7 to 6.9 |
| Onshore wind | 4.3 to 9.2 |
| Offshore wind | 5.5 to 10.3 |
| Combined cycle gas turbine | 10.9 to 18.1 |
| Lignite | 15.1 to 25.7 |
| Hard coal | 17.3 to 29.3 |
| New nuclear | 13.6 to 49.0 |
The figures come from the Fraunhofer ISE 2024 study, which also hosts its study overview page.
Two patterns stand out. First, the ranges are wide. The study attributes the spread for nuclear mainly to the intervals of full load hours and investment costs assumed. Second, the fossil technologies sit above wind and solar partly because of the carbon price: the study says the LCOE for newly built coal plants exceeds 15 €cents/kWh because of rising CO2 certificate prices, and that the CO2 price plays a crucial role for gas turbines. The study also states that the follow-up costs of nuclear power and the costs of waste disposal are not included in its LCOE figures.
What the IEA and NEA found internationally
Outside Germany, the picture is similar but more varied. The IEA and NEA report covers 243 plants in 24 countries, and its central finding is that the levelised costs of electricity generation of low-carbon generation technologies are falling and are increasingly below the costs of conventional fossil fuel generation.
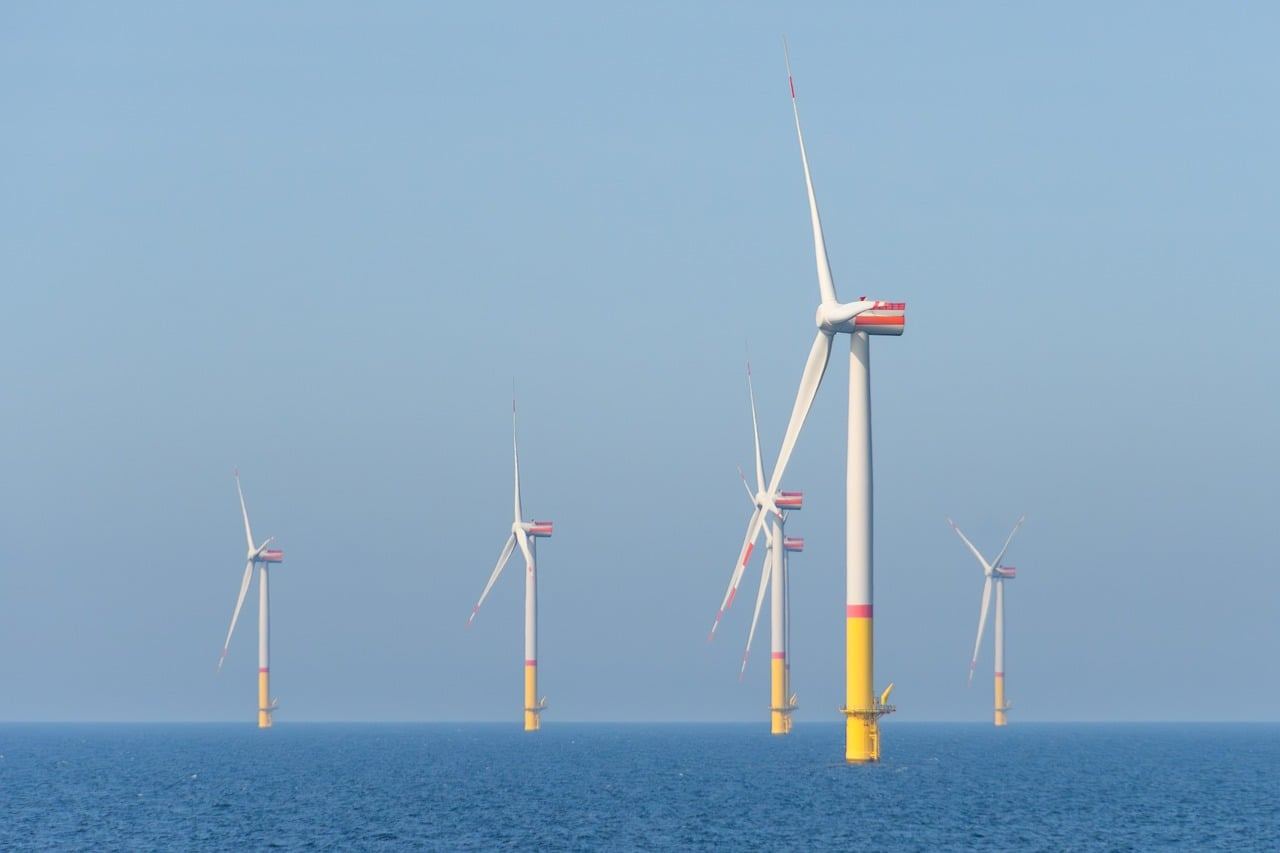
It reports that onshore wind is expected to have, on average, the lowest LCOE in 2025, true for a majority of countries (10 out of 14). Offshore wind showed the largest shift: five years earlier the median LCOE still exceeded USD 150/MWh, and in the 2020 edition it was significantly below USD 100/MWh, the same source says. Large-scale solar PV under favourable climatic conditions is also described as very cost competitive.
Where LCOE falls short
LCOE is a plant-level metric. It says nothing about when the electricity is produced or what it is worth to the grid. The IEA addresses this with a second measure, the value-adjusted LCOE (VALCOE), and reports that the system value of variable renewables such as wind and solar decreases as their share in the power supply increases.
In practice a low LCOE does not by itself guarantee a profitable project, because a plant’s value depends on when it delivers power. Storage, grid expansion and flexible plants add costs that sit outside a single plant’s LCOE. Fraunhofer ISE reflects this by also calculating combined PV and battery systems and projecting that, by 2035, electricity from a PV-battery system is predicted to be significantly cheaper on average than from a combined cycle gas turbine plant.
Other limits are worth keeping in mind:
- Currency and inflation: the Fraunhofer ISE study says absolute values have mostly increased since the previous edition because of high inflation, so older and newer editions cannot be compared directly.
- Site dependence: irradiation, wind speed and grid-connection cost change the result for the same technology.
- Assumed lifetime and full load hours: a small change in either shifts the figure noticeably.
- Selling price: a contracted price, such as under a solar power purchase agreement, sets revenue separately from cost, so a project can have a competitive LCOE and still face a poor price.
How to read an LCOE figure
A figure is most useful when its origin is clear. Check which year the study uses as the price base, whether costs are real or nominal, which discount rate applies, how many full load hours are assumed and whether carbon costs, grid connection or decommissioning are included. The Fraunhofer ISE study, for example, calculates all costs and discount rates using real values with 2024 as the base year, and states that a direct comparison with its earlier publications is not permissible.
Used with those checks, LCOE is a sound first screen. For decisions about a specific project or system, it is one input next to market prices, grid constraints and financing terms.
Frequently asked questions
What does LCOE stand for?
Show answer
LCOE stands for levelized cost of electricity, also written levelised cost of electricity. It is the lifetime cost of a power plant divided by the lifetime energy it generates.
Is solar cheaper than gas by this measure?
Show answer
In the Fraunhofer ISE 2024 figures for new German plants, ground-mounted PV is below the range for combined cycle gas turbines. That is a plant-level comparison; it does not include the cost of balancing variable output.
What is VALCOE?
Show answer
VALCOE is the IEA’s value-adjusted LCOE. It adds system effects and system costs to the plain plant-level metric, so technologies that deliver power at different times can be compared more fairly.
Why do studies report different LCOE values for the same technology?
Show answer
Studies differ in country, base year, discount rate, assumed full load hours and investment costs. The IEA and Fraunhofer ISE publications both state their assumptions, and the numbers should be read together with them.