The capacity factor of solar and wind is the share of a plant’s maximum possible output that it actually delivers over a period, usually a year. Both technologies sit well below full utilisation, because sunshine and wind come and go.
It is one of the core yardsticks in the renewable energy guide, used to compare technologies that behave very differently once they are connected to a grid.
| Key fact | Detail |
|---|---|
| Capacity factor definition | ratio of produced to continuous full-power energy |
| Capacity factor, plain version | Actual output compared with total potential output over time |
| Base-load operation | Per the EIA, capacity factors of 70% or higher indicate it |
| Peaking units | Per the EIA, tend to run at less than 15% capacity factor |
| US utility-scale solar PV | Per the EIA, operated at about 25% of their electricity generating capacity, based on an average of annual values from 2014 through 2017 |
| Arizona utility-scale solar PV | Per the EIA, achieved a 29.1% capacity factor from 2014 through 2017, better than any other state |
Figures from www.eia.gov; they can change, so check the source before you rely on them.
What capacity factor measures
The U.S. Energy Information Administration defines the term in its glossary as the ratio of the electrical energy produced by a generating unit over a period to the energy that could have been produced at continuous full power operation during the same period. In plainer terms, a plant that delivers as much in a year as it would running at full power nonstop for part of that year has a capacity factor equal to that part.
The EIA’s electricity overview describes the same idea as the ratio of actual output to the total potential output over time. It adds that capacity factors of 70% or higher indicate base-load operation, while units that run in peaking service tend to operate at less than 15% capacity factor. Those two benchmarks matter for what follows: a low capacity factor is not automatically a sign of a poor plant, because the number reflects how the plant is used or how much fuel it can count on.
European engineering studies often express the same quantity as full load hours, meaning the hours per year a plant would need at full power to produce its annual output. A higher number of full load hours means a higher capacity factor, and the two can be converted into each other. The Fraunhofer ISE study on the cost of electricity from renewable energy technologies uses full load hours throughout, and it is the main European source used below.
Capacity factor of solar photovoltaics
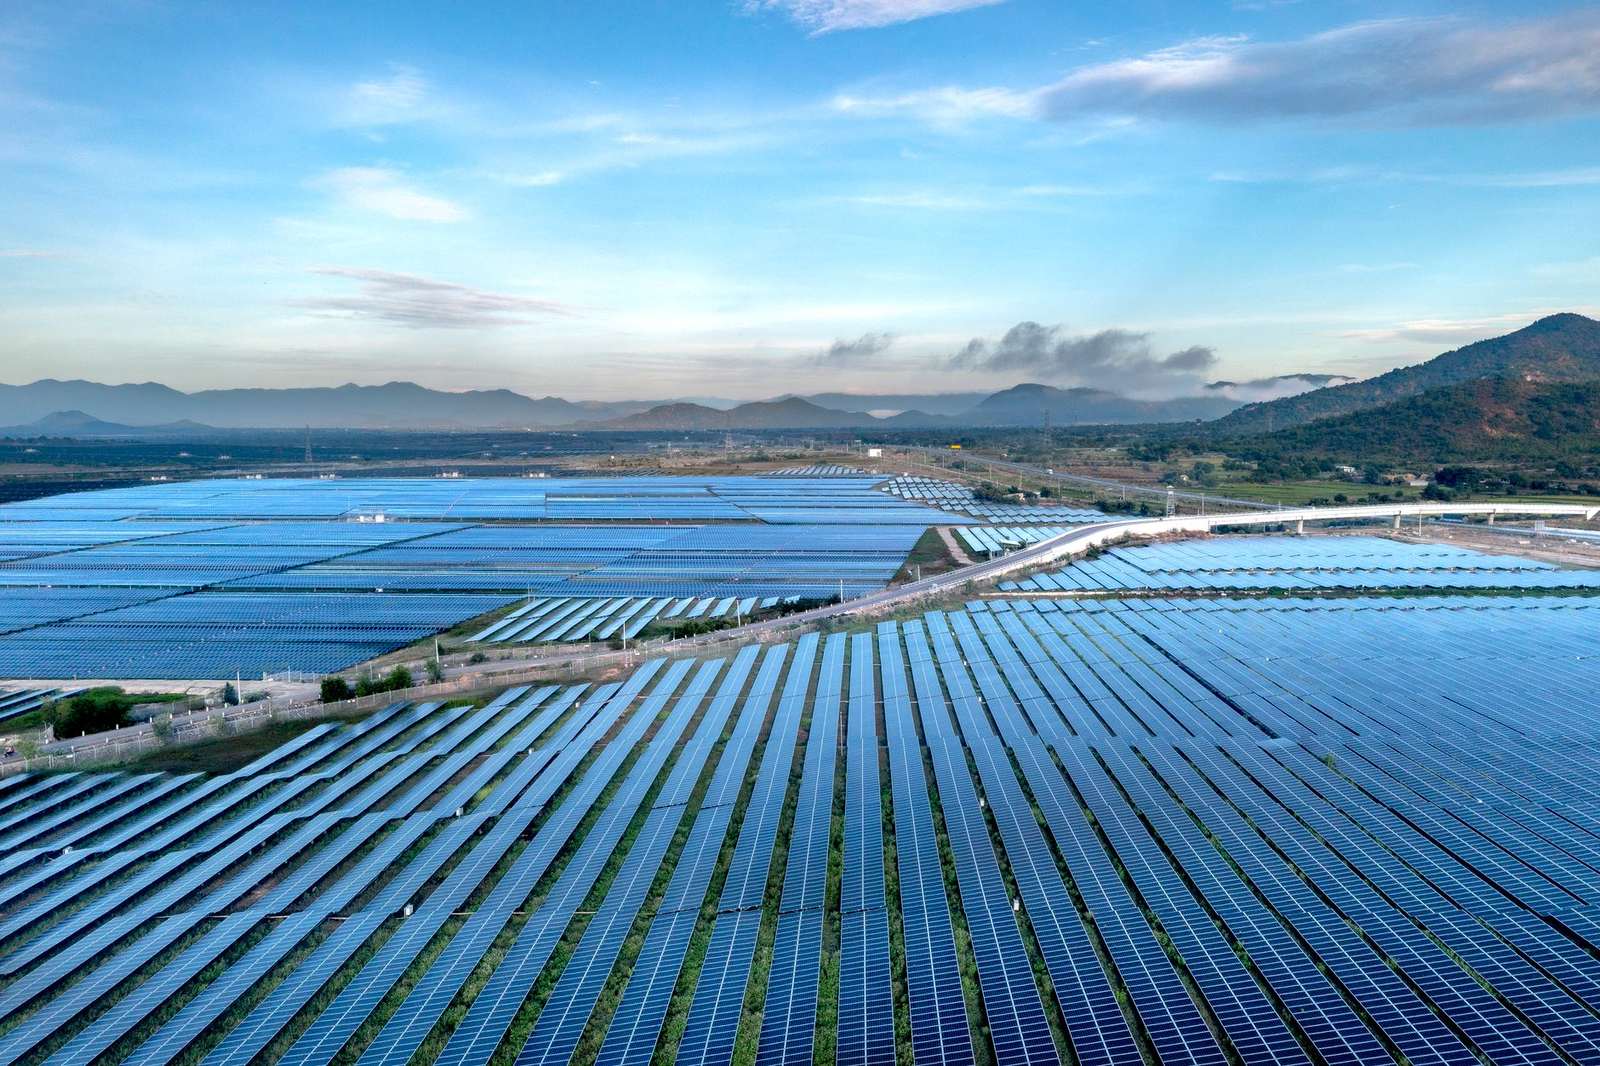
Solar output depends on irradiation, which differs by region, and on plant design. The EIA reports in its analysis of solar capacity factors that utility-scale solar PV plants in the United States operated at about 25% of their generating capacity on average, based on annual values from 2014 through 2017. The best state, Arizona, achieved a 29.1% capacity factor over the same years, and the EIA notes that northeastern states such as New Jersey and Massachusetts had even lower capacity factors than the Southeast.
The same page names the main drivers: resource quality, tracking capabilities and inverter-sizing considerations. Resource quality is simply how much direct, high-angle sunlight a site receives. Tracking systems follow the sun and lift output across the day. Larger inverters, relative to the panel capacity, allow a plant to deliver more of its output as grid-ready AC power.
In Europe the picture is shaped mainly by latitude and mounting. According to the Fraunhofer ISE study, solar systems in Germany reach an average annual electricity yield between 935 and 1280 kWh per installed kWp after losses, with the lower end in the north and the higher end in the south. Because a kilowatt-peak of capacity delivering one kilowatt for an hour yields one kilowatt-hour, those yields can be read directly as full load hours. The same study notes that full load hours decrease if systems face east or west because of roof inclination or if they are mounted at a flatter angle, though this can still make economic sense when the owner wants to use the power on site.
Capacity factor of wind power
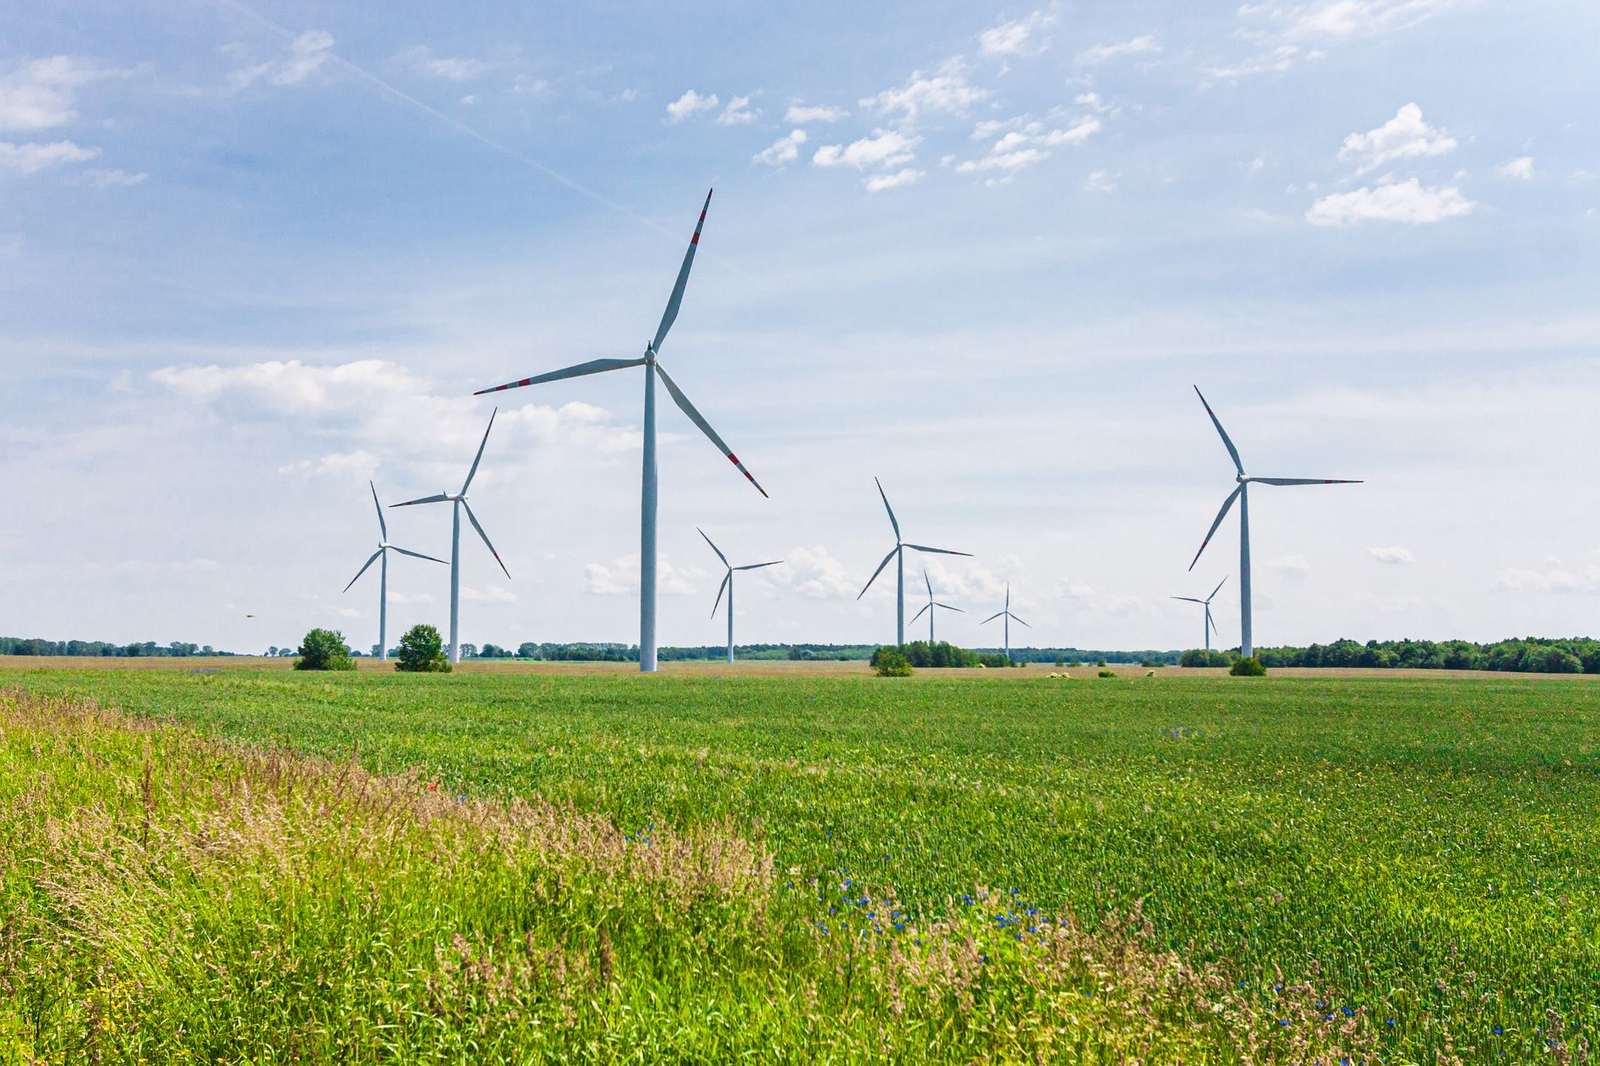
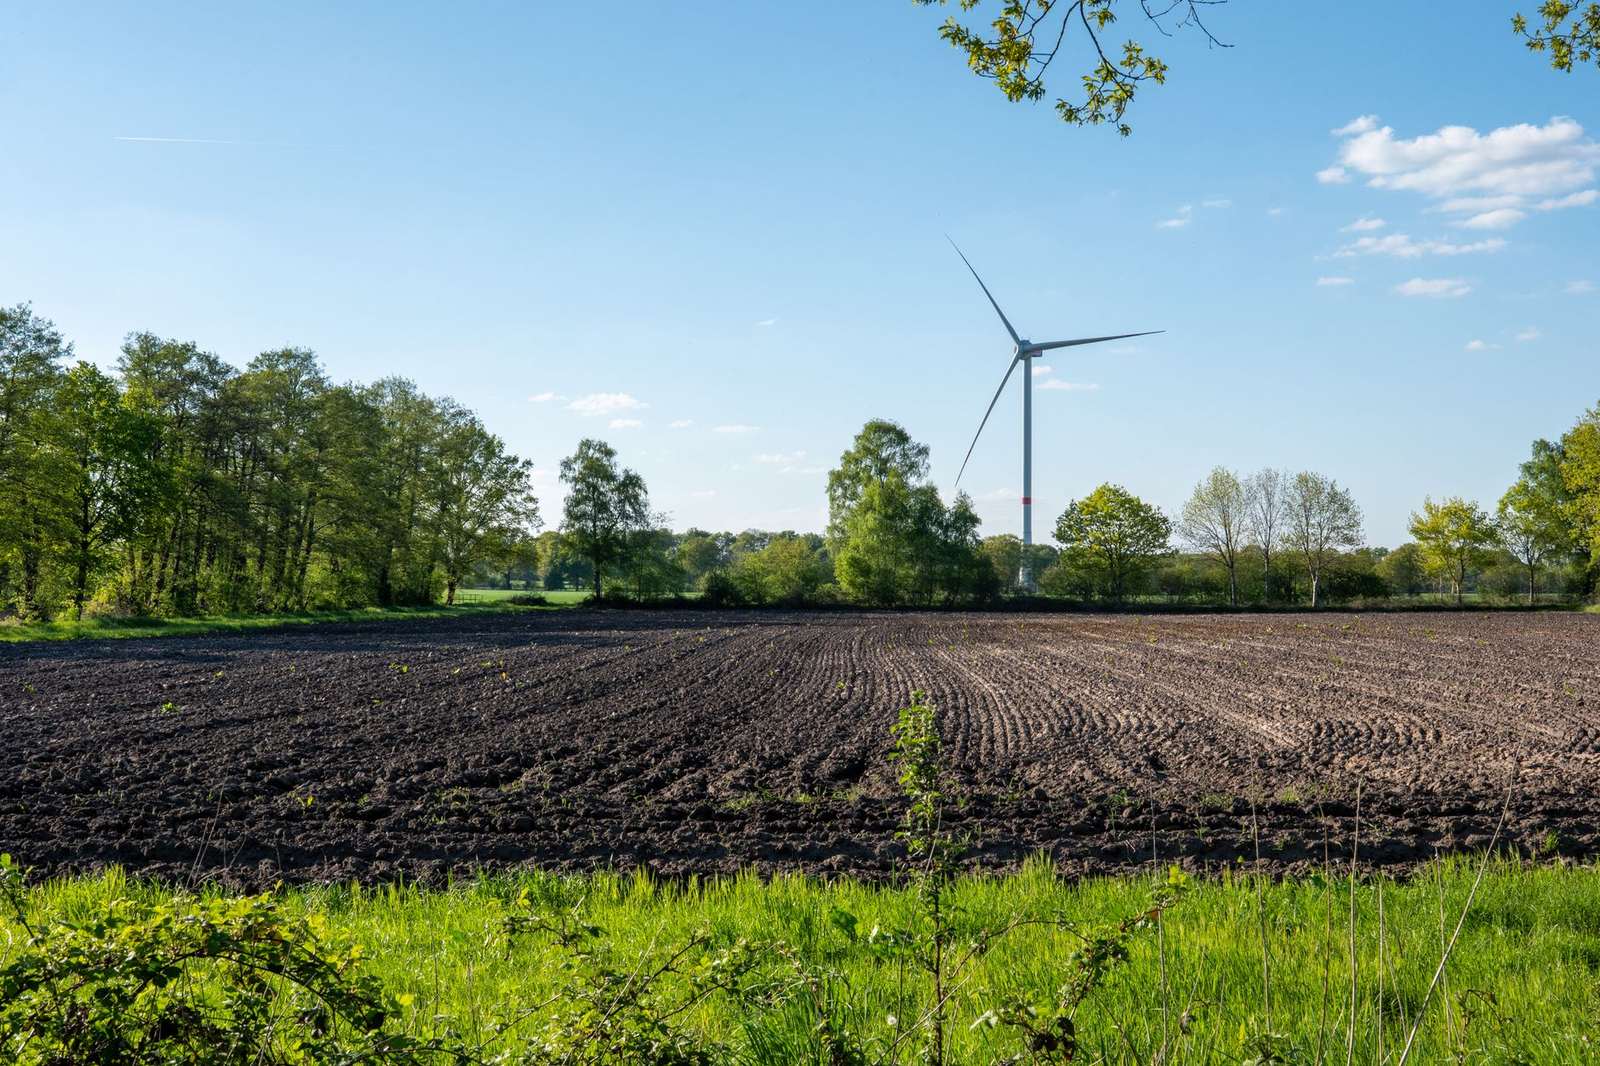
Wind output depends on wind speed at hub height, which rises with distance from the ground and, usually, with distance from the coast. The Fraunhofer ISE study models onshore wind in Germany at 1800 to 3200 full load hours per year and offshore wind at 3200 to 4500 full load hours per year. Inland sites sit at the low end, northern sites in the middle, and coastal and high-wind locations at the top of the onshore range.
The same study gives a reference point for what has actually been built: the average value for onshore wind systems built in 2016 is 2721 full load hours per year. It also explains why offshore turbines do better, with offshore systems achieving full load hours from 3200 hours per year near the coast to up to 4500 hours per year at more distant locations in the North Sea.
Wind therefore spans a much wider range than solar. A turbine on a poor inland site and one in the North Sea can differ widely in annual yield, even with the same rated power. This spread is the reason developers measure wind resources at a site before committing capital, and it is also why national averages say less about a specific project than they do for solar.
Solar and wind compared with other power plants
Annual averages from the same dataset make the comparison concrete. The table lists U.S. utility-scale generators for 2025, as published in the EIA’s Electric Power Monthly.
| Generator type | Capacity factor, 2025 |
|---|---|
| Nuclear | 91.1% |
| Natural gas, combined cycle | 58.7% |
| Coal | 48.8% |
| Wind | 33.8% |
| Solar photovoltaic | 24.0% |
The values come from the EIA tables for non-fossil generators and fossil-fuel generators.
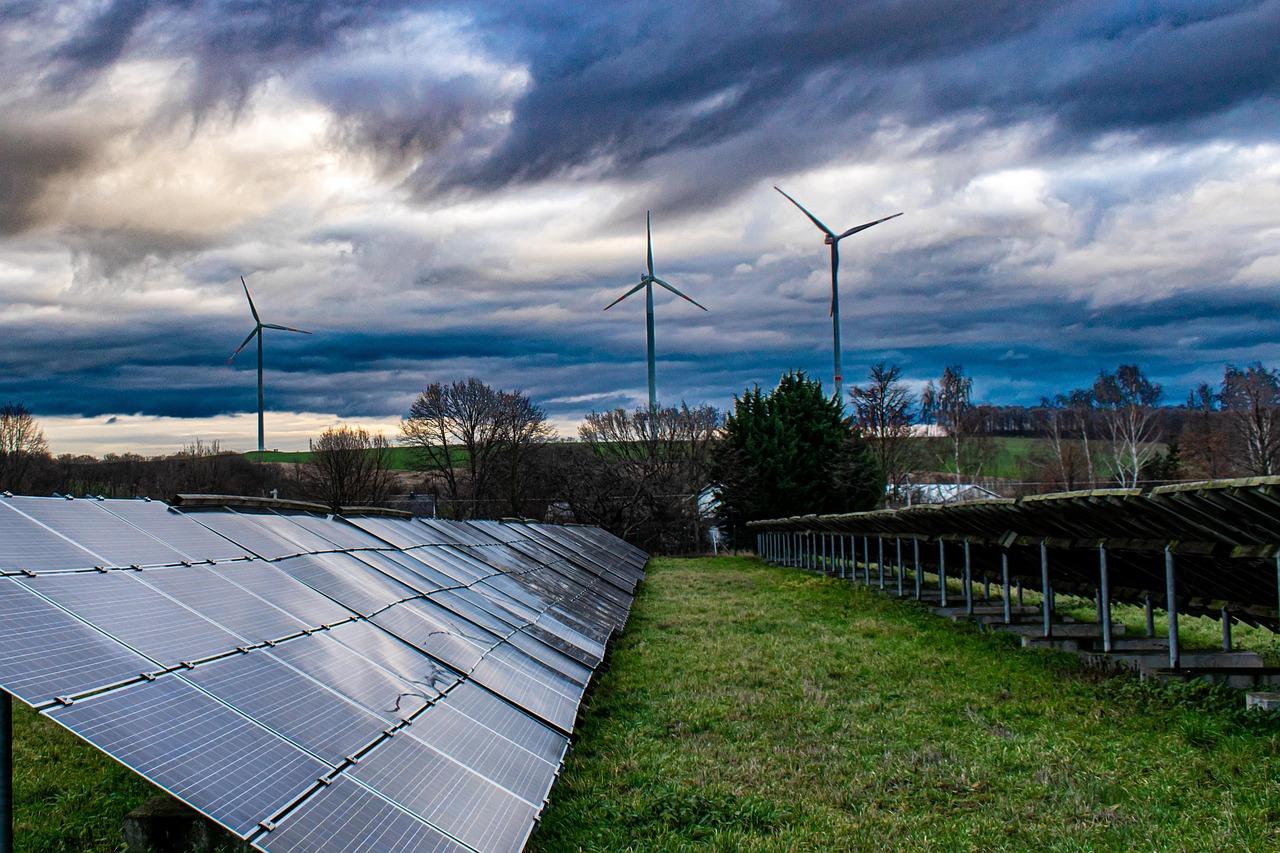
Wind and solar rank lowest, which follows directly from physics: the plant cannot generate when the resource is absent. Nuclear sits at the top of the table because it runs almost continuously and is shut down mainly for refuelling and maintenance. Fossil plants fall in between because they are dispatched according to demand and prices rather than the weather.
German data show the same direction in full load hours. The Fraunhofer ISE study reports that lignite plants averaged 4366 hours in 2023, hard coal 2050 hours, and gas-fired combined cycle and turbine plants 2241 hours. It expects the full load hours of conventional power plants to decrease steadily as the share of renewables grows. In other words, the gap between fossil plants and renewables narrows from both sides: renewables are being built in better locations with taller turbines, while fossil plants run less often.
Why a lower capacity factor does not mean a worse plant
Capacity factor describes utilisation, not quality or cost. A solar plant with a modest factor can still be among the cheapest sources of electricity, because it has no fuel cost and low operating cost. Fraunhofer ISE concludes that ground-mounted PV systems and onshore wind turbines are among the most cost-effective technologies in Germany. The way the metric feeds into costs is explained in the article on the levelized cost of electricity, where full load hours are one of the key inputs.
The International Energy Agency’s Projected Costs of Generating Electricity shows how sensitive the comparison is to this input. Its base cases assume an 85% capacity factor for nuclear, coal and combined cycle gas plants, and it also provides estimates at 50% load factors for dispatchable baseload technologies such as gas, coal and nuclear. The same report points out that the system value of variable renewables such as wind and solar decreases as their share in the power supply increases, which is a reminder that a plant’s output at the wrong hour is worth less than output when the grid needs it.
That is where timing enters. Two plants with the same capacity factor can serve a grid very differently if one produces at midday and the other in the evening. Storage can shift output between those hours, and the article on battery storage for solar describes how batteries are used to raise the value of each kilowatt-hour a solar plant produces without changing how much sunlight the site receives.
What moves the capacity factor of a plant
For an operating plant, the capacity factor is the result of several separate effects, and only some of them are under the owner’s control.
- Resource: irradiation for solar, wind speed for wind. This is fixed by the site, which is why the EIA lists resource quality first.
- Design: tracking, panel tilt and orientation, inverter sizing and, for wind, hub height and rotor size. Fraunhofer ISE expects low-wind turbines and new sites to lift onshore full load hours over time.
- Availability: downtime for faults and maintenance lowers the factor directly, and good maintenance practice protects it.
- Curtailment and dispatch: output that grid operators or market prices push down is energy the plant could have produced but did not, so it lowers the measured capacity factor.
Because the measure compares actual output with the maximum possible, any restriction on output lowers it, even when the plant itself is working perfectly.
Frequently asked questions
What is a good capacity factor for solar?
Show answer
It depends on the location. The EIA found that U.S. utility-scale solar PV averaged about 25% from 2014 through 2017, with the best state, Arizona, reaching 29.1%. In Germany, yields of 935 to 1280 kWh per installed kWp are reported by Fraunhofer ISE, depending on region.
Why is wind capacity factor higher than solar?
Show answer
A solar plant produces only in daylight, while wind can blow at any hour. In the EIA’s 2025 annual data, wind reached 33.8% and solar photovoltaic 24.0%.
Is capacity factor the same as efficiency?
Show answer
No. Efficiency describes how much of the incoming energy a device converts into electricity. Capacity factor compares actual output over time with the output at continuous full power.
Do full load hours and capacity factor mean the same thing?
Show answer
They express the same relationship in different units. Full load hours state how many hours at full power would produce the annual output, as in the Fraunhofer ISE range of 1800 to 3200 full load hours per year for onshore wind in Germany.