Solar plant monitoring collects electrical and weather data from a photovoltaic plant, so you can see whether it is producing what it should. The larger and more complex the plant, the more intensive the monitoring.
It is the data backbone of the services summarised in the overview of solar O&M services. This page explains what is measured, how the data should be handled and how monitoring supports maintenance decisions.
| Item | What the source says |
|---|---|
| Key signals | Power, current and voltage, plus climate data from weather stations. |
| Commonly recorded variables | Often irradiance, temperature, wind speed and wind direction. |
| Level of monitoring | Larger, more complex plants need more intensive monitoring. |
| Input data quality | It directly influences how certain the calculated KPIs are. |
| Filling data gaps | Even the best imputation strategies will inevitably increase uncertainty. |
Figures come from the IEA PVPS KPI report summary and O&M guidelines summary; this information can change, so check the sources for the latest version.
What a monitoring system measures
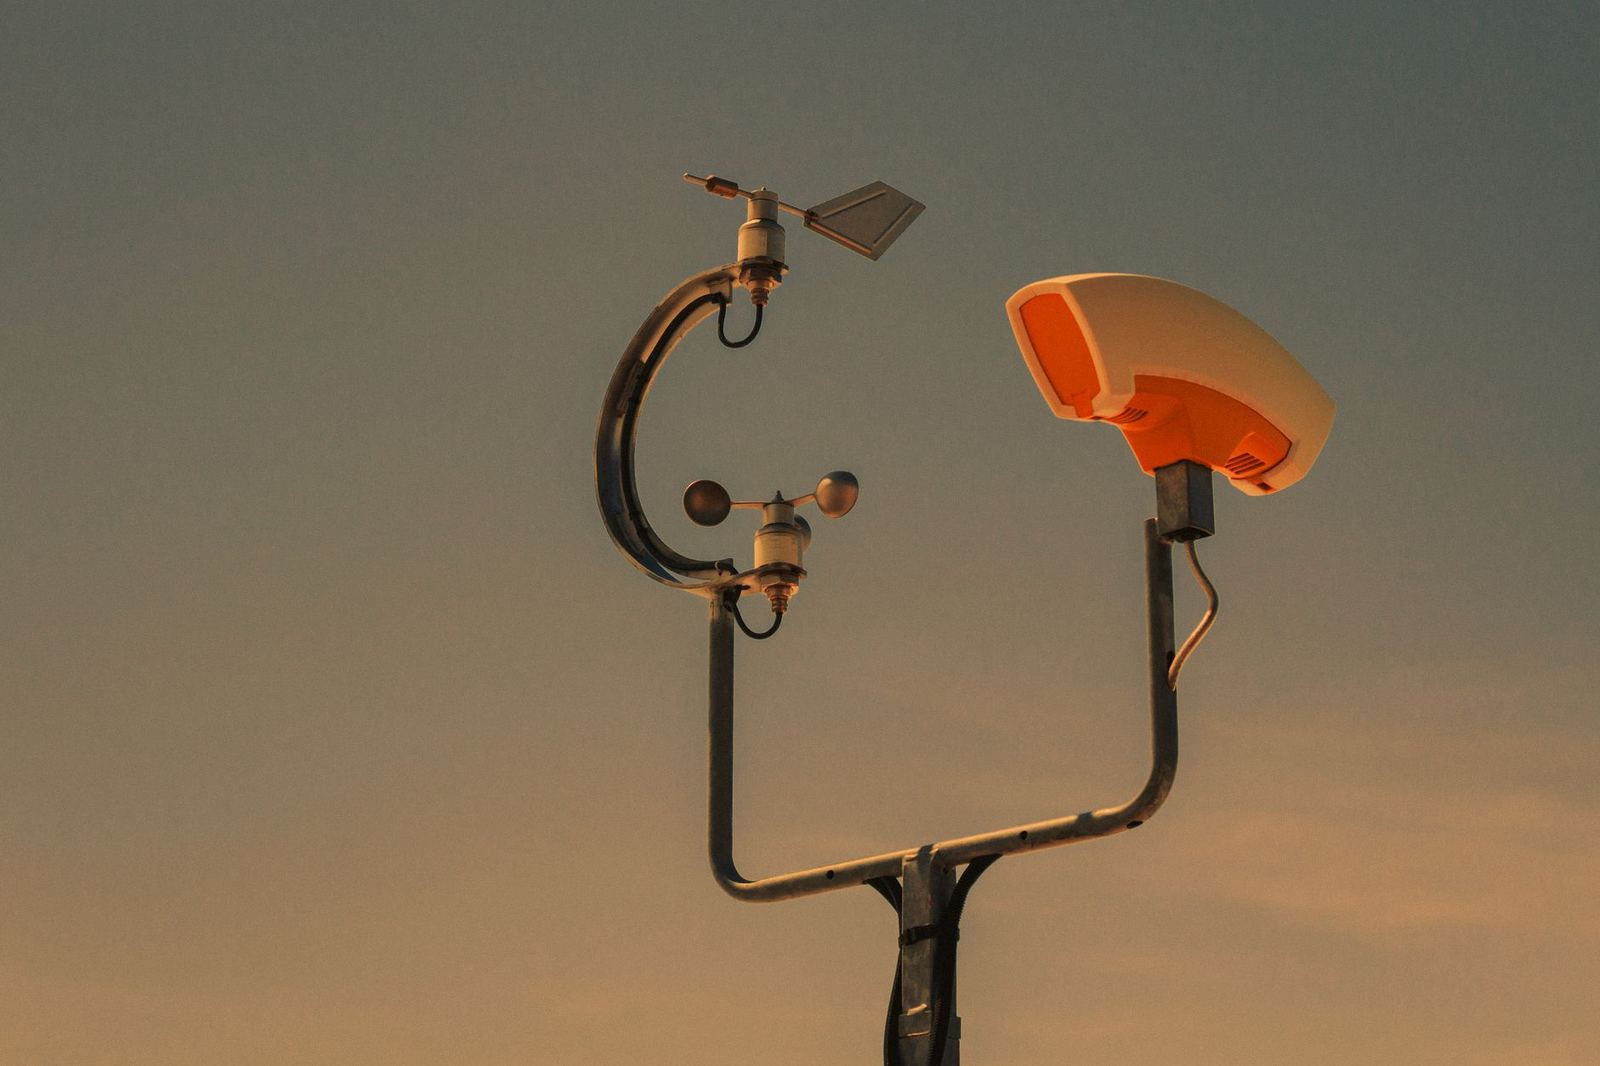
A monitoring system links sensors and controllers to a data logger and a supervisory platform. The IEA PVPS report on technical and economic indicators discusses the most important signals: power, current and voltage values from the PV system, together with climatic variables from weather stations. It notes that commonly recorded variables include irradiance, temperature, wind speed and wind direction, in the report summary.
Each variable answers a different question. Inverter and string data show how much electricity is produced and where it is lost. Irradiance shows how much sunlight arrived, and temperature explains why output falls on hot days. Wind speed and direction matter for structural loads and for cooling. Without weather data, a dip in output cannot be told apart from a cloudy day.
The IEA PVPS O&M guidelines add that the scale and complexity of plants determine the level of monitoring: the larger and more complex the plant, the more intensive the monitoring. Minimum requirements are detailed in international standards such as IEC61724-1, as well as best practice guidelines such as the SunSpec Alliance, according to the guidelines summary.
Instruments and data logging
Good conclusions need good instruments. An engineering guide from the consultancy SgurrEnergy states that best practice uses a datalogger granularity of 1–15 minutes with at least three months of local storage plus cloud backup, and a Class A pyranometer in the plane of the array, as set out in its best practice guide. Local storage means a communication outage does not erase history, and cloud backup protects against loss of the logger itself.
The position of the irradiance sensor matters because it defines the reference for every performance calculation. The same guide warns that the performance ratio is easily misread: it is misleading if taken from GHI instead of plane-of-array irradiance, from soiled sensors, or on a plant that regularly clips. Sensors therefore need cleaning and calibration as part of the maintenance routine, which is why the schedule in the page on solar preventive maintenance includes instrument calibration.
Alarms, dashboards and response
The most visible function of monitoring is alarming. Inverter faults, communication losses, grid disconnections and string anomalies generate alerts that are routed to an operator or a maintenance team. Alarm rules need tuning: too many nuisance alerts train staff to ignore them, while too few let real faults run for days. A good system prioritises alerts by lost energy, so that a failed central inverter is handled before a single underperforming string.
Alarms connect directly to contractual response times. The IEA PVPS guidelines recommend including at least one operator indicator, such as Guaranteed Performance Ratio, Guaranteed Plant Availability, and Response Time in the contract. Monitoring supplies the timestamps that prove when an alarm was raised, when it was acknowledged and when the plant came back, so the same data that finds faults also settles disputes.
Dashboards give owners and asset managers a summary view: energy produced against forecast, availability, performance indicators and open incidents. The commercial side of that reporting is discussed in the page on solar asset management; the point here is that dashboards are only as reliable as the data feeding them.
Data quality
The IEA PVPS report is direct about data quality: the quality of the input data directly influences the certainty of the calculated PV system indicators, so data quality and data cleaning steps within the data processing cycle are of utmost importance. It lists key data quality criteria to consider as accuracy, completeness, consistency, timeliness and reliability.
Gaps are unavoidable, since loggers fail and networks drop. The report presents findings on imputing, or filling, data gaps in power, irradiance and temperature series, but states that even the best imputation strategies will inevitably increase uncertainty. It also argues that high-quality data should be viewed as an investment that enables better evidence-based decision-making, rather than as a cost that diminishes system profitability.
The same report warns that, despite the nominal standardization of contractual indicators such as the performance ratio and temperature-corrected performance ratio, there are still considerable variations in the data quality routines employed. Two plants can report the same indicator and mean different things. Monitoring contracts should therefore say how bad data is flagged, removed or filled.
Ownership of the data deserves a clause in every contract. Plant owners generally want unrestricted access to raw measurements, in an open format, so that a change of O&M provider or monitoring vendor does not strand the history. Without that access, comparisons across years, warranty claims and independent performance reviews all become harder. Specifying who owns the data, who may export it and how long it is kept costs nothing at signing and saves arguments later.
A monitoring review is also worth scheduling once a year. The review checks that every inverter, meter and sensor is reporting, that time stamps are consistent, that alarm thresholds still match the plant, and that dashboards agree with the revenue meter. Plants change over time as equipment is replaced and settings drift, and the monitoring configuration has to keep pace.
From monitoring to predictive maintenance
Data collected over years supports more than alarms. The IEA PVPS guidelines recommend predictive maintenance services with data collection devices on site to create an intelligent monitoring system that helps gather insights on specific failures and underperformance. Trends in string current, inverter temperature or availability can show a component drifting before it fails, and they can reveal gradual ageing at the plant level. The expected pace of that ageing is explained in the page on the solar panel degradation rate.
Monitoring is also changing in other ways. Aerial infrared and visual imagery from drones are described by the IEA PVPS report as exploitable data resources alongside raw time series and satellite weather data, and they complement electrical data by locating faults on the array. Electrical data says that something is wrong; imagery says where.
Finally, the control side needs protection. The SgurrEnergy guide says that VPN access is a minimum, that port-forwarding should be avoided, and that a formal cybersecurity management system should govern the plant’s control systems. A monitoring system that can send commands to inverters is part of the electrical infrastructure and must be secured like it.
Frequently asked questions
What is solar plant monitoring?
Show answer
It is the continuous measurement of electrical output and weather conditions at a plant, with a supervisory system that stores data, raises alarms and supports reporting.
Which variables are monitored?
Show answer
Power, current and voltage from the PV system, plus irradiance, temperature, wind speed and wind direction from weather stations.
Why does data quality matter so much?
Show answer
Because the certainty of every calculated indicator depends on the input data, and filling gaps always adds uncertainty.
Does monitoring replace site visits?
Show answer
No. Monitoring shows where to look and what to prioritise, while inspections and repairs still require people on site.