

The solar performance ratio compares what a photovoltaic plant actually produced with what a model predicts for the same weather. It lets you judge a plant’s health however sunny the period was.
It is one of the main indicators used in solar O&M services and contracts. This page defines the ratio, shows how it is calculated and explains the pitfalls that make two published values hard to compare.
| Item | What to know |
|---|---|
| Definition | Fraction of expected power output when the plant is available |
| Calculation | Actual metered production compared with modelled production over the selected period |
| Evaluation period | Can be evaluated instantaneously, monthly or annually |
| Achievable values | A performance ratio of 85% and availability of 95% should be achievable |
| Short assessments | Use a temperature-corrected PR for commissioning or operator handover |
| Misreading | Misleading if taken from GHI instead of plane-of-array irradiance |
Figures come from US FEMP and SgurrEnergy; this information can change, so check the sources for current guidance.
What the performance ratio is
Raw energy output is a poor measure of plant quality, because a sunny month always beats a cloudy one. The performance ratio removes that effect. The US Federal Energy Management Program explains that the ratio refers to the fraction of the expected power output when the plant is available, and that it is calculated as the ratio of actual production, measured by a production meter on the PV system, to model production, which is based on a computer model of the same measured solar resource and temperature data over the selected time period, in its operations guidance. The same source notes that the ratio can be evaluated over any time period, instantaneously, monthly or annually.
A simpler way to state the idea is yield divided by reference yield. The SgurrEnergy best practice guide describes plant performance as tracked through Reference Yield, Specific Yield and the Performance Ratio, where PR = Specific Yield / Reference Yield, in its guide to utility-scale O&M. Reference yield is the energy the sunlight on the array would deliver at standard conditions, and specific yield is the energy the plant delivered for each unit of installed capacity.
How it is calculated
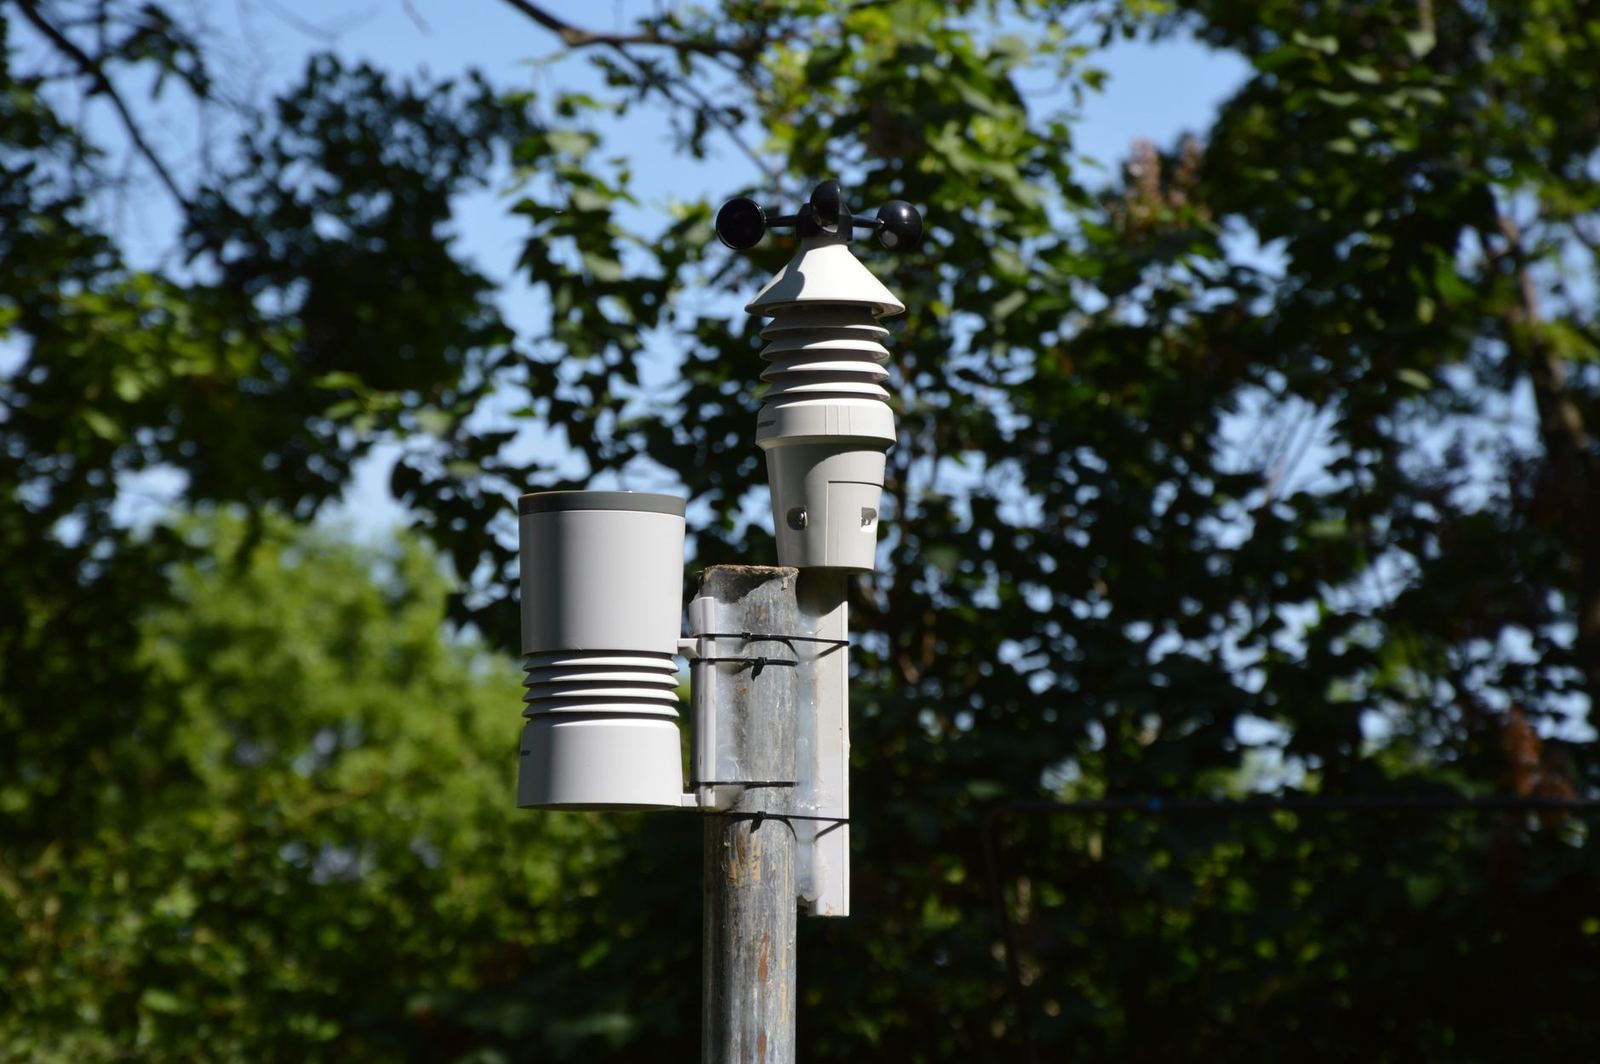
The calculation needs three ingredients: metered energy at the plant, measured irradiance in the plane of the array and, for the temperature-corrected version, the module temperature. Each has to be measured over the same period and screened for bad data. The ratio is then a single percentage that summarises all the losses between sunlight and meter: soiling, shading, temperature, module mismatch, wiring, inverter conversion, downtime and any curtailment.
The temperature-corrected version removes the effect of hot weather, which lowers output without any fault. The SgurrEnergy guide recommends that a temperature-corrected PR should be used for short assessment windows such as commissioning or operator handover. Over a full year the seasonal effects average out, and the plain ratio is often used.
Because every step depends on measurement quality, instruments matter. The monitoring needs behind the ratio, from sensor placement to data logging, are described in the page on solar plant monitoring on this site, and in the guidance published by the IEA PVPS programme.
What counts as a good value
There is no single target, because the result depends on technology, climate, design and age. As a general benchmark, FEMP’s evaluation indicates that a performance ratio of 85% and availability of 95% should be achievable. Its template for a normal operating condition adds that a system is operating within 80% of its weather-corrected performance ratio. Those numbers are useful for orientation, but a plant should be judged against its own model and its own history.
Trend matters more than a single reading. A ratio that falls steadily from year to year suggests ageing or a developing fault, while a sudden drop points to an event. Seasonal variation is normal in many climates, so comparisons should use the same months in different years. Within a plant, comparing inverter blocks against each other can show which parts of the site lag behind.
Why published values are hard to compare
The IEA PVPS report on technical and economic indicators warns that, despite the nominal standardization of contractual indicators such as the performance ratio and temperature-corrected performance ratio, there are still considerable variations in the data quality routines employed, and consequently, in the calculation of the resulting indicators, as the report summary states. Two plants quoting the same ratio may have excluded different periods or filtered sensors differently.
The SgurrEnergy guide lists common misreadings. The ratio is misleading if taken from global horizontal irradiance instead of plane-of-array irradiance, from soiled sensors, or on a plant that regularly clips. Each of these changes the denominator or the numerator without any change in the plant itself. Contracts should therefore state the sensor type, the calibration routine, the filtering rules and the treatment of unavailable and curtailed hours.
Curtailment is a frequent source of confusion, since output is limited while the plant is healthy. The treatment of such periods is explained in the page on solar curtailment, and the principle is to log the curtailment signal and exclude those periods from any comparison against the model.
Reading a low ratio step by step
A low value is a prompt for diagnosis, not a verdict. The first check is the measurement: whether the irradiance sensor is clean, correctly aligned and calibrated, and whether the meter data has gaps. Many apparent losses disappear at this stage. The second check is availability, since downtime enters the ratio directly. The third is curtailment and other external limits, which should be removed from the comparison if the plant was healthy during them.
If the cause is still unexplained, the analysis moves down a level. String and inverter data show whether the loss is spread evenly or concentrated in a block. An even loss suggests soiling, a sensor problem or general ageing, while a concentrated loss suggests a fault, shading or a specific degradation mechanism. Thermal imaging and current-voltage tests on samples then confirm what the data suggests, and the result goes into the corrective work plan with an estimate of the energy at stake.
Using the ratio in operations and contracts
The IEA PVPS guidelines say that an O&M contract should include at least one operator indicator, such as Guaranteed Performance Ratio, Guaranteed Plant Availability, and Response Time in the contract, according to the guidelines summary. A guaranteed ratio gives the owner a number to hold the contractor to, but it also rewards the contractor for factors outside its control unless the contract is written carefully.
When the ratio falls short, the causes are usually ordinary: dirt, shading from vegetation, inverter faults or degraded modules. Dirt is the easiest to fix, and the economics of cleaning are covered in the page on solar panel soiling losses. Reading the ratio together with availability and string-level data usually shows which cause dominates.
Frequently asked questions
What is the solar performance ratio?
Show answer
It is the ratio of the energy a plant actually produced to the energy a model predicts for the same measured sunlight and temperature over a chosen period.
Is a higher performance ratio always better?
Show answer
Generally yes, but only if it is calculated correctly. Wrong irradiance data, soiled sensors or unfiltered curtailed hours can make the ratio look better or worse than the plant really is.
What is the temperature-corrected performance ratio?
Show answer
It is a version of the ratio adjusted for module temperature, recommended for short assessment periods such as commissioning or handover.
Can the performance ratio be part of an O&M contract?
Show answer
Yes. A guaranteed performance ratio is one of the indicators that the IEA PVPS guidelines suggest for O&M contracts, together with availability and response time.