The solar panel degradation rate is the yearly loss of a module’s or plant’s output as it ages. Published field studies put the typical figure at about 0.5% per year, though individual systems range far above and below it.
Degradation is one of the slow losses that operators track as part of solar O&M services. This page explains how the rate is defined, what typical values look like and why measured figures vary so much.
| Key fact | Detail |
|---|---|
| Median reported degradation rate | 0.5 %/year |
| Module degradation rate | Often about 0.5% per year |
| Missing data threshold | The IEA PVPS summary recommends imputation if more than 10% of the daytime data is missing |
| Heavy data filtering | Can introduce strong bias in reported loss rates |
| Performance ratio or power metric | Choice does not strongly influence the results |
Figures from digital.library.unt.edu and www.energy.gov; they can change, so check the source before you rely on them.
What the degradation rate measures
Every module loses some output over time, through gradual changes such as encapsulant ageing, cell damage and connection wear. The degradation rate expresses that loss as a percentage of initial output per year. When the whole plant is measured instead of a single module, the result is usually called the performance loss rate, because it also captures losses that are not caused by the modules themselves, such as soiling build-up or equipment faults.
The IEA PVPS report on performance loss rate explains why the number matters commercially: the loss rate is used by power plant owners, operators and investors to determine the expected power output of a PV system over its installed life, as the report summary states. A small change in the assumed rate changes the forecast energy of every future year, and therefore the value of the plant.
Typical degradation rates
The figure most often quoted comes from a long series of field studies by the US National Renewable Energy Laboratory. Its conference paper on outdoor degradation notes that the median historically reported degradation rate is 0.5 %/year, as stated in the NREL paper. The US Federal Energy Management Program uses the same value, describing module age and degradation rate as often about 0.5% per year according to the PV O&M Best Practices report, in its operations guidance.
A median hides a wide spread. The IEA PVPS benchmarking study looked at 19 high quality research systems. It reports that nine systems had loss rates between -0.4%/annum to -1%/a, 3 systems showed lower values, and six had larger values in the range from -1%/a to -4%/a, according to the same benchmarking summary. A planner should therefore treat the median as a starting assumption and not as a promise for any given plant.
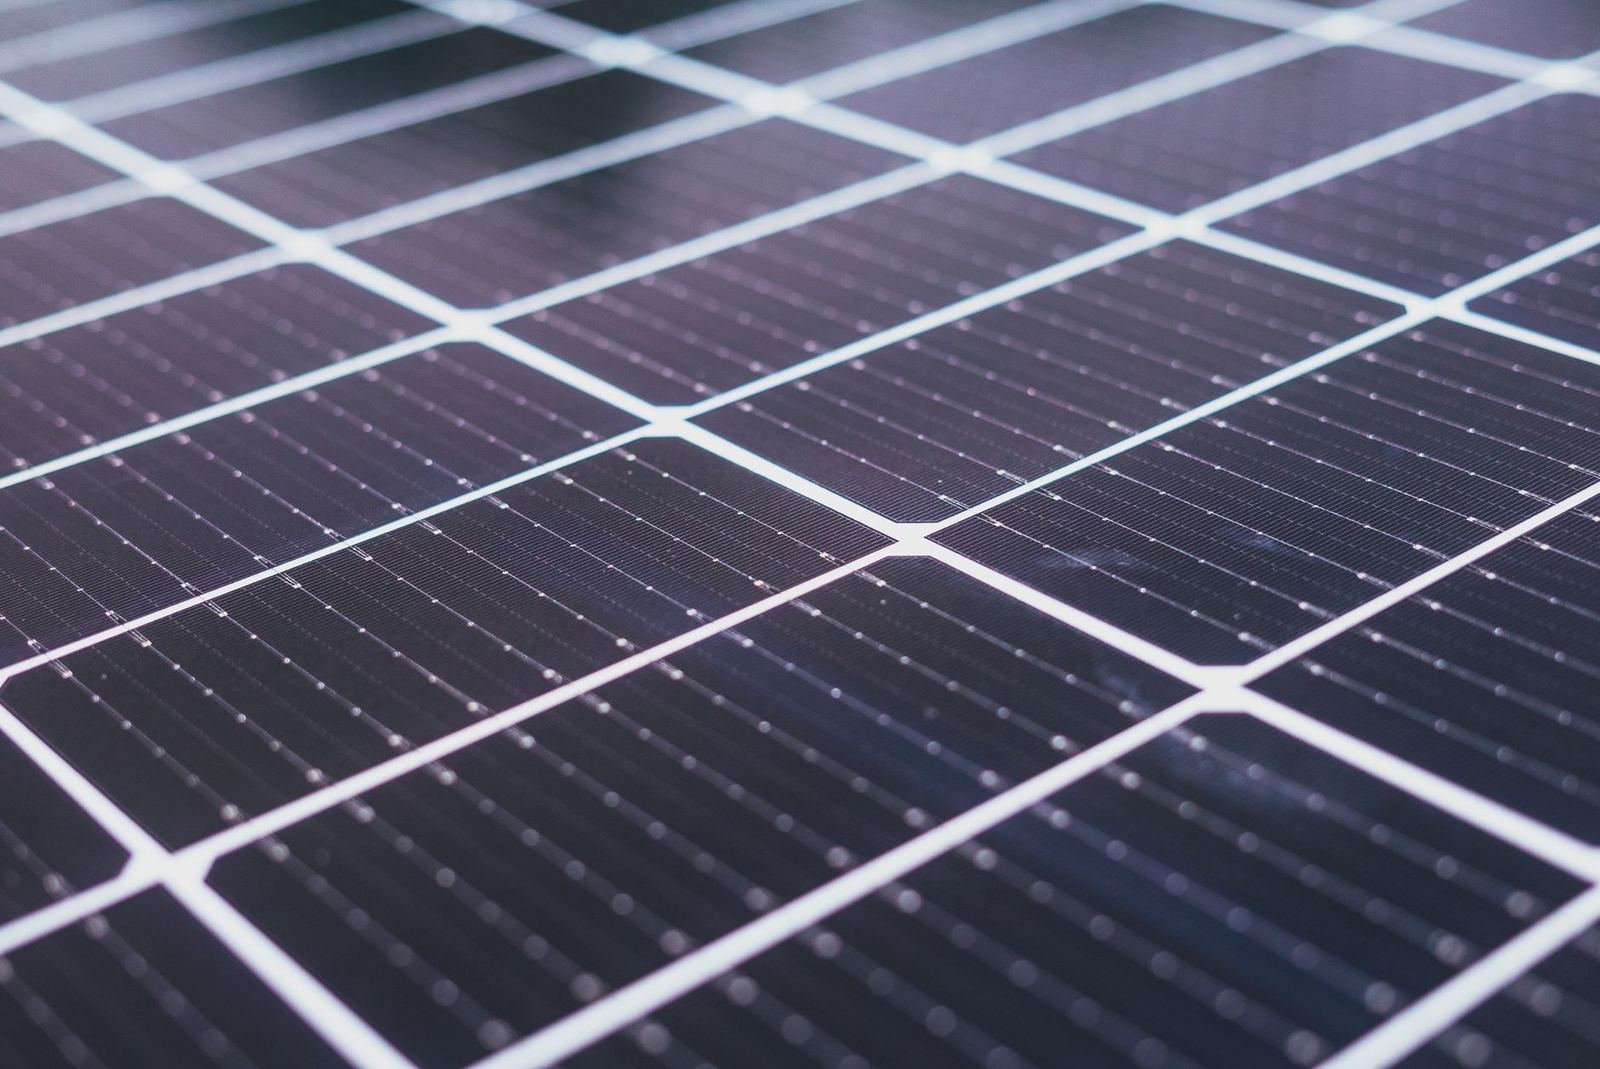
- Median reported degradation rate: 0.5 %/year
- Module degradation rate: 0.5% per year
- Missing data threshold: 10%
Why measured rates differ
Real differences between plants have several causes. Module technology matters, because different cell types and materials age differently. Climate matters, since heat, humidity, ultraviolet light and temperature cycling all stress modules. Installation quality matters, as poor mounting, damaged connectors or voltage stress add losses that no datasheet predicts. Individual failure mechanisms can also accelerate the decline, and one of the best known is described in the page on potential induced degradation.
Part of the difference is not physical at all. The same IEA PVPS study stresses that the calculation method and the quality of the data can change the answer. It states that heavy data filtering can introduce strong bias in the results, enabling a user to raise or lower the reported loss rate of a PV system, and that reported values need to be reproducible by others with clearly reported confidence intervals. A figure without a description of its filtering and uncertainty is hard to compare with any other.
The study also gives practical guidance on data gaps: if more than 10% of the daytime data is missing, data imputation techniques are recommended. And it finds that the choice of performance ratio or power in the calculation does not strongly influence the results, so either metric can be used.
Measuring degradation in practice
For an operating plant, the loss rate is estimated from years of monitoring data, corrected for weather. The IEA PVPS framework describes four common steps: cleaning and filtering the input data, selecting and correcting the performance metric, correcting time series features such as seasonality, and applying a statistical model to obtain the value. Because the choices at each step interact, two analysts can reach different numbers from the same data.
This is why a reliable monitoring record is the foundation of any degradation estimate. The data requirements are covered in the page on solar plant monitoring. In addition to long-term analysis, periodic tests on sampled modules, such as current-voltage curve tracing and thermal imaging, can show whether the loss comes from the modules or from the rest of the plant.
Gradual loss and sudden loss
Two patterns are worth separating. Gradual loss is the steady, near-linear decline that appears as a sloping line in multi-year data. Sudden loss comes from events: a lightning strike, a hail storm, a failed bypass diode, a flooded combiner box or a string disconnected by accident. Averaged over several years, both appear as a higher loss rate, but they call for different responses. Gradual loss is planned for in the financial model, while sudden loss is a fault to find, repair and, where possible, claim for.
This is one reason why plant-level data should be reviewed at regular intervals and not only at the end of a warranty period. A drop that appears in a single month points to an event, and the monitoring record usually shows when it happened. A slow slope that is steeper than the model assumed points instead to ageing, a design weakness or a systematic problem such as voltage stress.
Seasonal effects add noise. Output varies with temperature and irradiance, and some losses, such as snow cover or leaf fall, recur every year. Analysts therefore compare like with like: the same season in different years, or weather-corrected performance indicators, and not raw energy totals. Without that correction, a cold bright spring can mask a decline and a hot summer can exaggerate one.
What operators can do about it
Normal ageing cannot be stopped, but avoidable losses can be separated from it. Cleaning, vegetation control, connector checks and inverter servicing remove the losses that look like degradation but are not. Warranty terms usually promise a minimum output after a stated number of years, and a documented loss rate, backed by consistent data, is the evidence needed to make a claim.
Owners should also use a conservative rate in financial models and test it against the plant’s own history once a few years of data exist. If the measured trend is clearly worse than the assumption, the cause deserves investigation rather than acceptance, since a failing component or a design weakness can often be corrected.
Frequently asked questions
What is a normal degradation rate for solar panels?
Show answer
Field studies report a median of about 0.5% per year, but individual systems vary widely above and below that value.
Is degradation the same as performance loss?
Show answer
Not exactly. Degradation refers to the modules, while the plant-level performance loss rate also includes other effects such as soiling or equipment problems.
Why do published degradation figures disagree?
Show answer
Technology, climate and installation quality differ, and so do calculation methods, data filtering and data quality, all of which can shift the result.
How can degradation be measured on a plant?
Show answer
By analysing years of weather-corrected monitoring data with a documented statistical method, and by testing sampled modules on site.