Solar energy in the Netherlands supplied 17.8 percent of net electricity production in 2024, according to CBS. If you are curious about rooftops, grid limits or net metering, the table below gives a quick view.
This page covers how much solar the Dutch system holds, who owns it, why grid congestion has become the main brake, and what happens when net metering ends. For the wider picture across countries, see the overview of solar energy in europe.
| Item | What the source says |
|---|---|
| Panel capacity, end of 2024 | Installed panel capacity totalled 28 620 MWp. |
| Solar share of electricity, 2024 | Solar was 17.8 percent of net electricity production. |
| Non-home share of capacity | Non-homes provided the remaining 60 percent of panel capacity. |
| Net metering | The salderingsregeling stops from 1 January 2027. |
| Minimum payment for fed-in power | Until 2030, at least 50 percent of the bare supply tariff. |
Figures come from CBS and the Dutch government; this information can change, so check the sources for the latest.
Installed capacity and electricity share
Statistics Netherlands (CBS) compiles the national solar statistics together with the Netherlands Enterprise Agency (RVO). In its renewable energy report for 2024, CBS states that the total installed panel capacity reached 28 620 megawatt-peak (MWp) at the end of 2024. It also gives the inverter side: inverter capacity of solar installations was 25 635 MW. The two numbers describe the same fleet. Panel capacity is the direct-current rating of the modules, while inverter capacity is the alternating-current output that can actually reach the grid.
The gap between the two is deliberate. CBS notes that inverter capacity averages 87 percent of panel capacity in non-residential installations and 93 percent in homes. Plant designers oversize the module field relative to the inverter because modules rarely deliver their full rating, and a smaller inverter is cheaper. Readers comparing Dutch figures across sources should therefore check which basis a number uses before drawing conclusions.
Solar is a large part of electricity supply. CBS reports that solar power contributed 17.8 percent of net electricity production in the Netherlands in 2024. The statistician is open about the precision of such figures: it estimates the total inaccuracy of solar generation at 15 to 20 percent, because production is estimated from capacity and typical yield rather than metered plant by plant.
Rooftops, businesses and solar parks
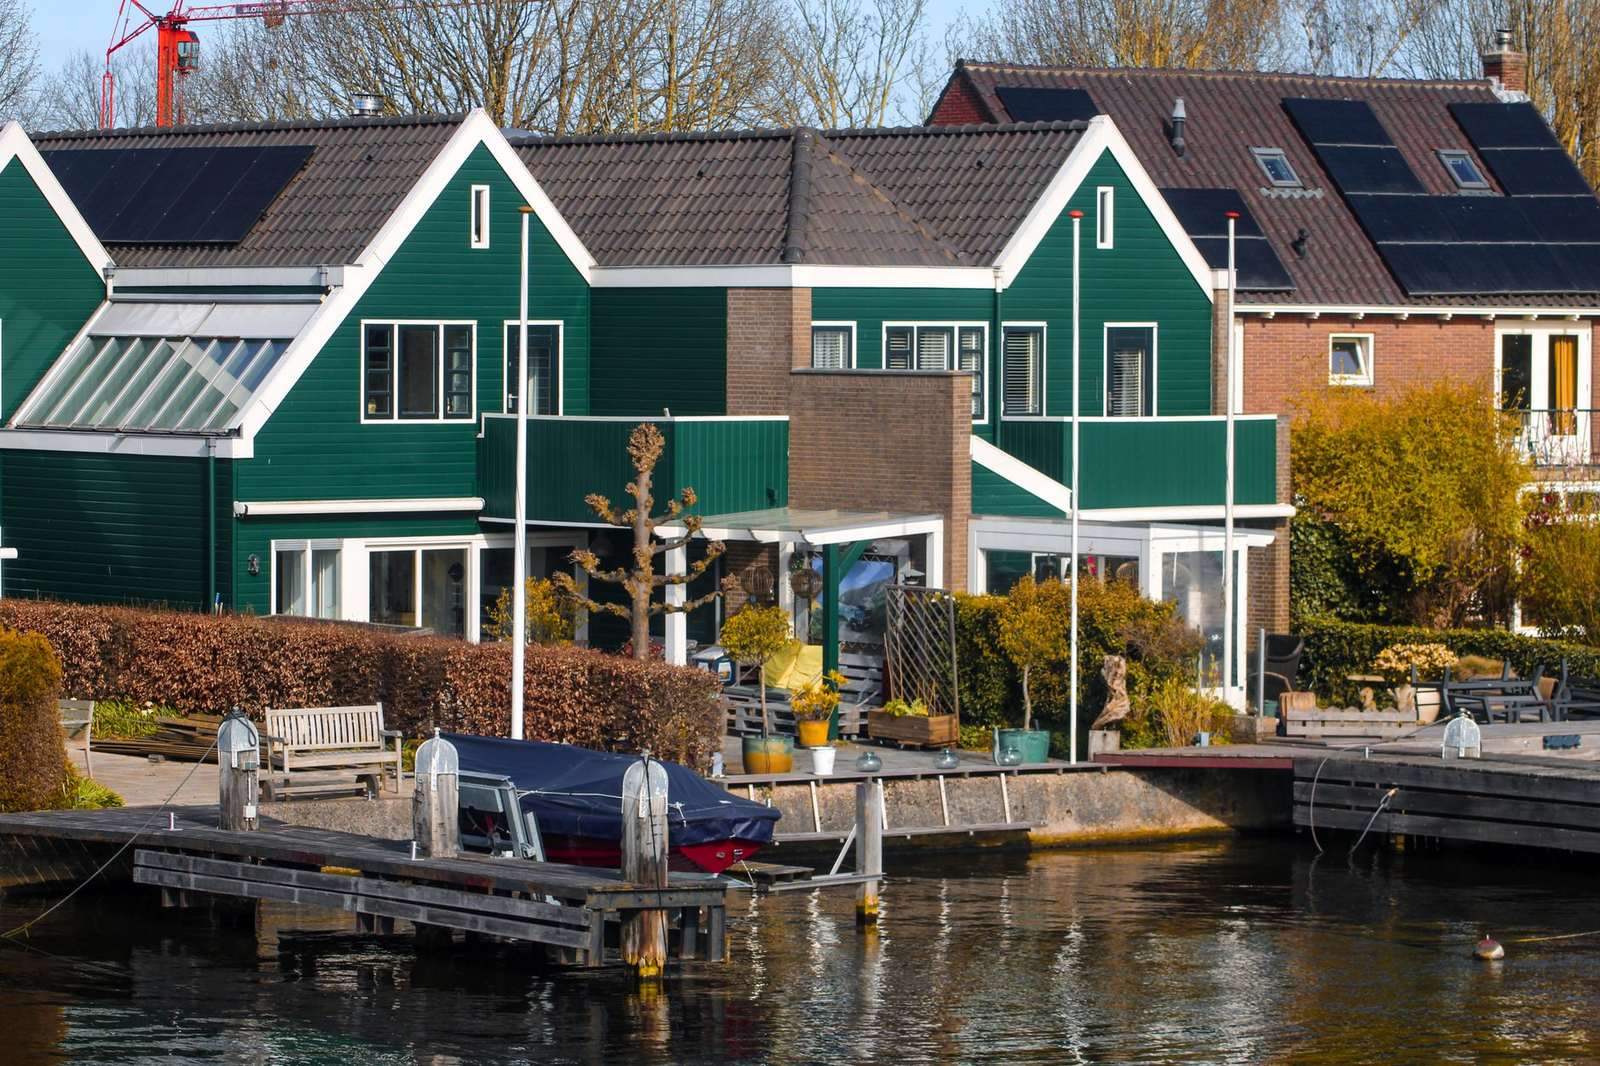
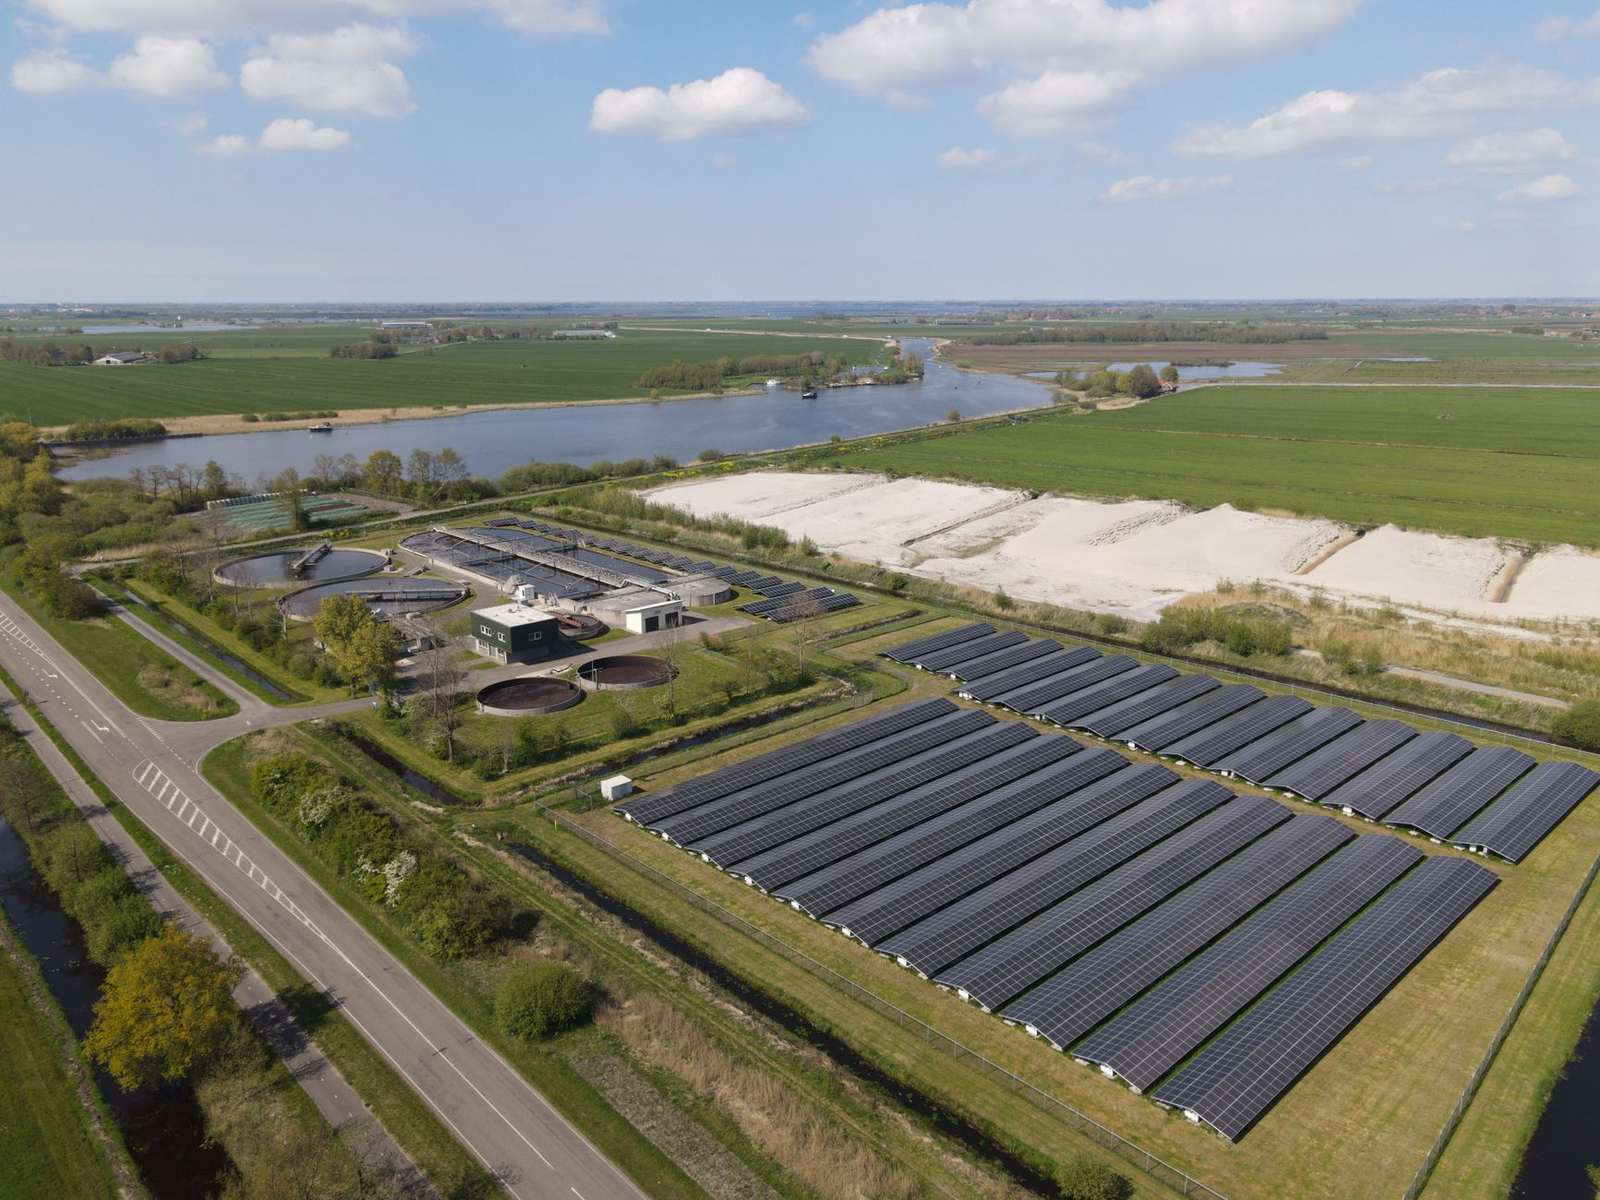
The Dutch fleet is unusual in how much of it sits on buildings. CBS attributes 11 672 MWp of the 2024 panel capacity to homes, while non-residential installations, such as businesses, government sites and solar parks, supply the remaining 60 percent. Home systems therefore make up the smaller share, but they are numerous and spread across the whole country.
Household uptake is now high. The IEA Photovoltaic Power Systems Programme country update reports that over 50 percent of house owners have installed solar panels, while the rental home market lags at an estimated 20 percent. The same update describes the market as one where the easy installations have been done, and where split incentives between landlords and tenants slow the next step. Tenants usually pay the electricity bill that panels would reduce, while the landlord would pay for the panels.
Regional output follows both population and available land. In the 2024 provincial breakdown, Noord-Brabant produced the most solar electricity at 3.674 TWh, followed by Gelderland at 3.029 TWh. The ranking follows where roofs, businesses and land for solar parks are concentrated.
Business parks and logistics sites are the other growth area. Large flat roofs suit solar well, and a company that uses most of its own output avoids exposure to wholesale prices. The programme’s country update notes that on business parks there is still much space, but congestion and split incentives obstruct a faster roll-out.
- RVO causes of withdrawn projects include grid congestion: netcongestie
- Grid congestion main driver: congestion
- Waiting lists grown: waiting lists
- Panel lifetime: the Dutch government says panels last 25 years on average
- Netting limit: according to business.gov.nl, SMEs with an electricity connection of 3×80 amperes at most
Slower growth after the boom years
Annual additions have slowed. CBS says that installed capacity grew again in 2024 but at a lower rate than in other years, both relative and absolute (translated from the Dutch original). For 2025 the picture is less clear. The IEA programme reports that CBS counted 647 MWp installed in the first half of the year, and that its own first estimate for the full year was possibly as much as 1.6 GWp of new capacity, significantly lower than in earlier years. It also expects that the total installed capacity will probably exceed 30 GWp.
Several forces explain the slowdown. The IEA update lists the gradual removal of support for adjacent technologies such as heat pumps and electric vehicles, a generally unfavourable market and uncertainty about government policy. Negative power prices at midday also reduce the value of exporting. In its own explanation CBS points to the planned end of net metering and the growing frequency of negative electricity prices as the topics discussed most.
The sector has responded with different products. Rather than panels alone, installers increasingly sell batteries, dynamic energy contracts and carports or integrated modules. The IEA update says that the major driver for these developments has been increasing grid congestion.
Grid congestion as the binding constraint
Grid congestion means that local cables and transformers have no room left to carry more power. In the Netherlands this applies to feeding electricity in as well as to taking it out. The IEA update records that waiting lists for new grid connections have grown, and that developers of new solar parks are advised to look at battery storage, cable pooling, peak shaving and congestion management.
Congestion also affects projects that already have a subsidy. When CBS discusses solar projects that were granted support but never built, it quotes RVO naming as causes of withdrawals changes to the roof construction, disappointing business cases and grid congestion (translated from the Dutch original). CBS adds that insufficient grid capacity may become a bigger limiting factor in future, with regional differences.
The national grid operator, TenneT, has adapted its tariffs. According to the IEA update, TenneT has reduced transport tariffs to a maximum of 65 percent for larger solar parks with battery storage, and it expects these measures to bring up to 5 GW of battery capacity for flexibility. The logic is that a battery lets a solar park fill the grid in the hours when capacity is free and hold back power at the busiest moments.
The same constraint changes how solar plants are run. Curtailment and peak shaving mean that output is sometimes deliberately limited, so operators track availability and grid signals as closely as irradiation. Owners of large plants increasingly care about when a plant exports, not only how much energy it produces over a year.
Energy hubs are one proposed answer. The IEA update notes that RVO estimates that over 1,000 locations are suited to energy hubs, with another 3 GWp of capacity by 2030. A hub groups generation, storage and demand behind a shared grid connection so that the connection is used more evenly through the day.
Subsidies and the end of net metering
Dutch support is split between schemes for large and small owners. For large installations, the main instrument is the SDE++ subsidy. CBS reports that nearly 47 percent of the capacity added in 2023 came from SDE applications. The IEA update adds that in 2025 the budget available in the SDE++ category for larger systems reached 8 billion euros, with stricter conditions that favour nature-inclusive solar parks such as those using vertical panels.
For households the central instrument has been net metering, called the salderingsregeling. The Dutch government states that the net metering scheme stops from 1 January 2027. Until then, an owner can offset electricity fed to the grid against electricity used, and taxes are due only on the net amount. Small businesses are covered as well, as the Netherlands Enterprise Agency explains that the scheme applies to connections of at most 3×80 amperes.
After the end date, owners receive a payment from their supplier for each kilowatt-hour they feed in, and the government has set a floor under it. The official guidance says that until 2030 this payment must be at least 50 percent of the bare supply tariff, meaning the electricity price without taxes. The government’s stated aim is to encourage owners to use as much of their own power as possible, which relieves the grid.
Panels remain worthwhile in the government’s view. The official page says that panels last 25 years on average and that payback happens well within that time, but also that payback can take longer after the scheme ends. The result is a market where self-consumption, batteries and flexible tariffs matter more than the size of the roof.
This transition mirrors a wider European pattern of moving from fixed support towards market exposure. For a comparison with a Mediterranean country where merchant risk and curtailment are also central, see the page on solar energy in spain.
Targets, EU rules and the outlook
Dutch solar policy sits within European climate law. National renewable shares and permitting rules follow the framework described in the eu renewable energy directive, which sets binding objectives that member states translate into their own support and planning rules. In the Netherlands the practical bottlenecks are grid reinforcement and spatial planning rather than the headline target.
Lead times matter. The IEA update points out that lead times for grid reinforcement are long, which has revived interest in decentralised systems, and the market’s response has been to build storage, share connections and consume more power on site. Solar parks that combine batteries with cable pooling can reduce the peak they place on the grid.
For operators and investors, three themes follow. First, the grid connection is now a project asset as valuable as the site itself, so connection timing shapes the whole business case. Second, revenues depend on the hours in which a plant exports, so storage and curtailment control are part of normal operation. Third, household demand is shifting from pure export to self-consumption, as shown by the growing pairing of panels with batteries and heat pumps.
The data themselves keep improving. CBS says that it is working with other parties on a better method to estimate production, and the statistical margin noted above is expected to narrow. Anyone using Dutch figures should treat capacity as the firmer number and generation as an estimate with a stated margin.
Frequently asked questions
How much solar capacity does the Netherlands have?
Show answer
CBS reports that the installed panel capacity was 28 620 MWp at the end of 2024, and the IEA programme expects that the total will probably exceed 30 GWp after 2025.
When does net metering end in the Netherlands?
Show answer
Net metering ends on 1 January 2027. Suppliers then pay compensation for electricity fed back into the grid, and no offsetting against use is possible.
What is the minimum compensation after net metering?
Show answer
Official guidance says that until 2030 the compensation must be at least 50 percent of the bare supply tariff.
What share of Dutch electricity is solar?
Show answer
CBS reports that solar contributed 17.8 percent of net electricity production in 2024.
Why is grid congestion a problem for solar?
Show answer
Local grids have limited room, and the IEA programme notes that waiting lists for new grid connections have grown. Many new projects therefore add batteries or limit export at peak times.