Solar energy in Germany totalled 117 GW of installed capacity at the end of 2025, according to the federal network regulator. The 2030 target of 215 GW means building has to keep going.
This page covers Germany’s capacity, where the panels are going, the policy rules and the grid effects. For the wider picture across countries, see the overview of solar energy in europe.
| Item | What it means |
|---|---|
| Installed solar capacity, end of 2025 | Germany totalled 117 GW |
| Solar added in 2025 | 16.4 GW, slightly less than in 2024 |
| Yearly build needed for 2030 | An annual average of 19.6 GW for the 215 GW target |
| Leading state in 2025 | Bavaria had the most new solar capacity, 4.5 GW |
| Solar share of electricity use, 2025 | Photovoltaics covered 17 percent of gross inland consumption |
Figures come from the Bundesnetzagentur and Fraunhofer ISE; they can change, so check the sources for the latest numbers.
Installed capacity and recent additions
The Bundesnetzagentur, Germany’s federal network regulator, publishes preliminary build-out figures each January. For 2025 it reported that solar capacity grew by 16.4 GW, slightly less than in 2024, bringing the national total to 117 GW. Solar led all technologies in new capacity, and the regulator’s president described the result as good progress towards the expansion targets.
Solar is part of a larger renewable fleet. According to the same release, total renewable capacity reached just under 210 GW, and the increase came mainly from solar and wind. Onshore wind is the second large block: the regulator recorded 68.1 GW of onshore wind at the end of 2025.
A figure quoted for the same year can therefore differ by several gigawatts without either number being wrong. When comparing sources, it helps to check which basis is used.
Rooftops, ground-mounted plants and plug-in systems
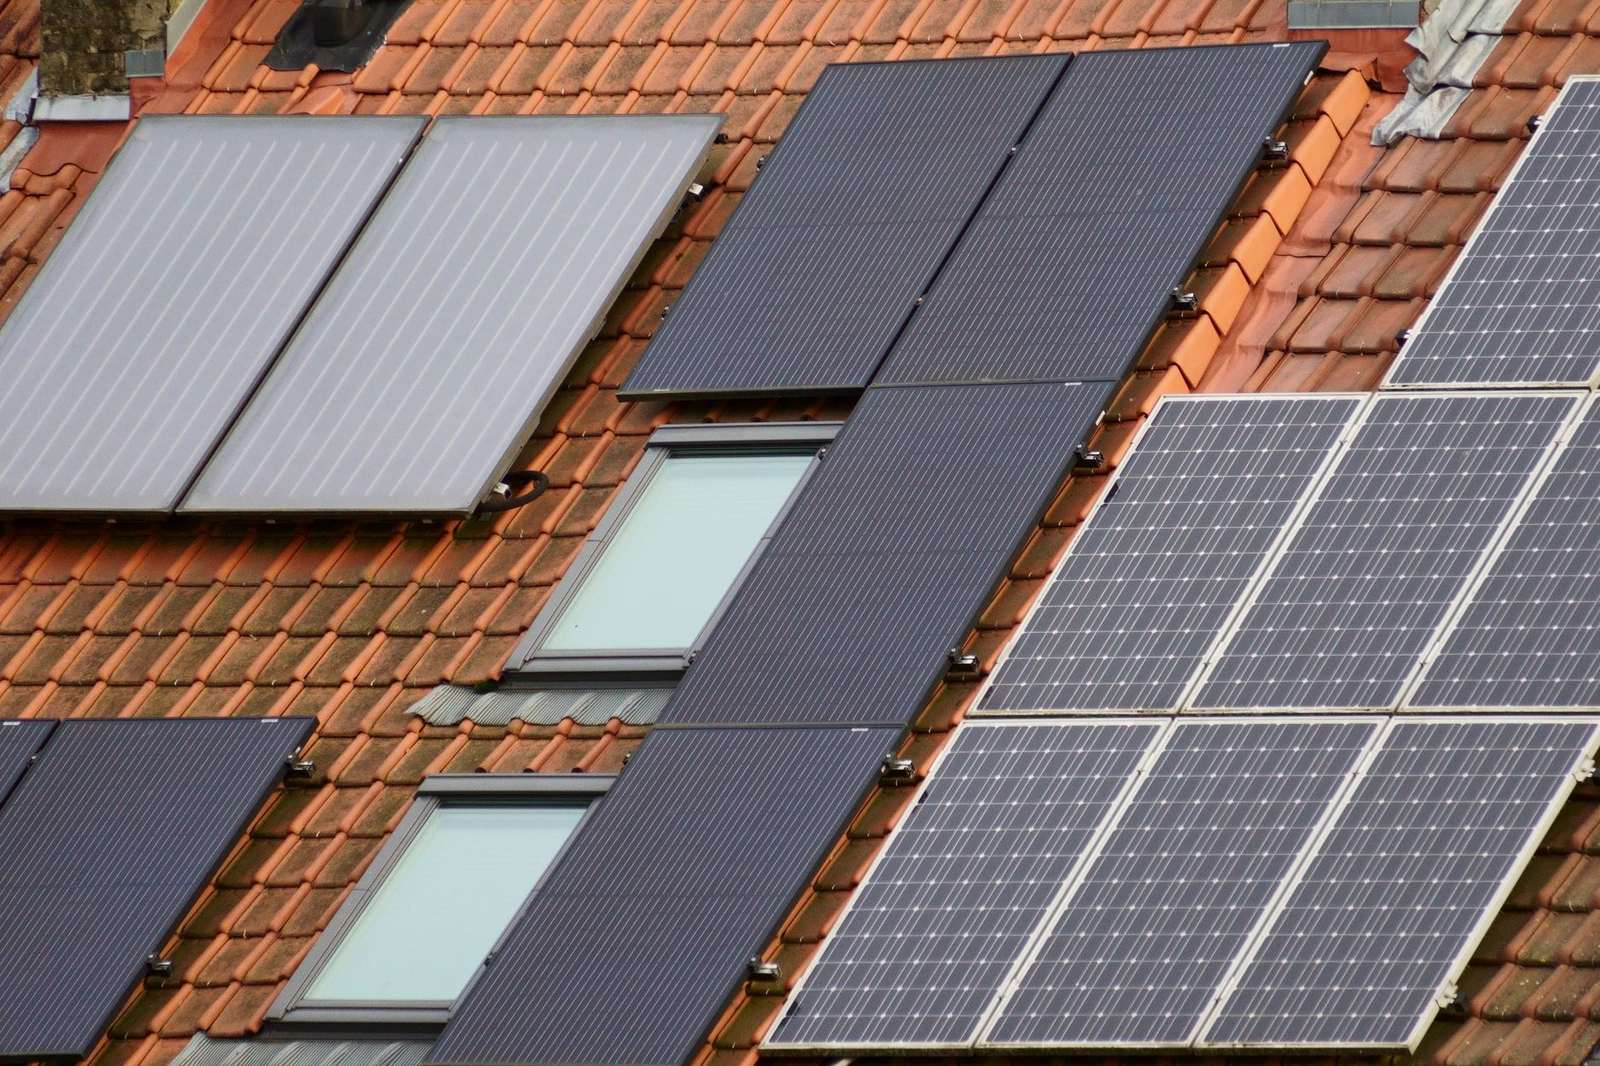
German solar splits into several segments with different economics. Rooftop systems on homes and businesses serve self-consumption, ground-mounted plants supply the grid at scale, and plug-in systems are small kits that feed a household circuit.
The mix has shifted recently. In 2025, just under half of the added capacity was on buildings and the rest was ground-mounted, whereas in 2024 there had been twice as much new building-mounted as ground-mounted capacity. Ground-mounted growth has been helped by competitive tenders for large plants, while rooftop growth depends heavily on household and commercial electricity prices.
Regional distribution is uneven. Bavaria added the most solar capacity of any federal state in 2025, at 4.5 GW. Southern states benefit from higher irradiation, but land availability, grid connection queues and local permitting also decide where plants are built.
Plug-in balcony systems are a visible but small slice. The regulator registered about 430,000 new plug-in installations in 2025, which it puts at about 3.2% of new capacity, up from 2.5% in 2024. They matter for public participation in the energy transition more than for the capacity total.
- Plug-in balcony installations 2025: 430,000 installations; 3.2% (0.5 GW)
- Negative price hours: rising number
- Three EEG remuneration models: three models
- Tender remuneration for large plants: tenders
- 2024 building vs ground-mounted: twice as much building-mounted
Targets and the build-out gap
Germany’s renewable energy law sets a cumulative solar target for 2030. The Bundesnetzagentur notes that an annual average of 19.6 GW would have to be added in the coming years to reach the 215 GW target by 2030. Since 2025 additions were 16.4 GW, the pace needs to rise modestly rather than double.
The target is tied to a consumption forecast. Fraunhofer ISE calculates that, based on a forecast gross electricity consumption of 658 TWh in 2030, expansion to 215 GW would give solar a share of about 30 percent. That share shows why the target matters: solar is expected to become one of the main sources in the system, not a niche contributor.
Reaching the target depends on factors beyond installer capacity. Grid connection times, module supply, skilled labour and the rules for self-consumption and feed-in all affect the annual number. Policy changes to remuneration, covered below, also shape how many rooftop systems are built.
How much electricity solar supplies
Installed capacity is one measure; delivered energy is another. Fraunhofer ISE reports that photovoltaics generated 92 TWh in 2025 and covered 17 percent of gross inland electricity consumption, while all renewable sources together covered 55 percent.
Output is seasonal and records are set in the summer months. Fraunhofer ISE’s analysis of the first half of 2026 found that feed-in from photovoltaics reached an all-time high of 43.2 TWh, up from 39.3 TWh in the previous first half. In that period, renewables supplied 61.8 percent of net public electricity generation.
The gap between capacity and energy comes from the capacity factor. A solar plant in Germany produces at full rated power for only a fraction of the year, so a gigawatt of solar yields far less annual energy than a gigawatt of a dispatchable plant. That is why expansion targets are set in gigawatts while system adequacy is judged in terawatt-hours and in hourly profiles.
Support rules and negative prices
Support for solar in Germany has moved from fixed payments towards market exposure. Large plants win remuneration through tenders, and smaller plants have a choice between a fixed feed-in payment and direct marketing with a market premium. Fraunhofer ISE describes three basic EEG remuneration models, a fixed tariff or market premiums for direct marketing, with remuneration for large plants set in bidding rounds. The longer history of such schemes across the continent is covered in the guide to feed-in tariffs in europe.
A February 2025 reform changed the treatment of price spikes. The federal government explains that new photovoltaic systems no longer receive the state-supported feed-in payment when prices are negative and are meant to market their own power more easily instead. The government states that this also applies to smaller systems.
The reason is visible in the market data. Fraunhofer ISE notes that high levels of wind and solar generation are leading to an increasing number of hours with negative day-ahead prices. When many plants produce at once at midday, supply exceeds demand and the price falls below zero. Removing support in those hours gives operators a reason to curtail or shift output rather than push power into a saturated grid.
For owners, the practical result is that the value of a system depends more on when it generates and how much power is used on site. Combining panels with batteries, flexible loads or smart meters improves the economics, and orientations that spread output beyond the midday peak are becoming more interesting.
Costs, storage and grid flexibility
Solar is now a low-cost source of electricity in Germany. According to Fraunhofer ISE, new megawatt-scale power plants produce electricity at about 4-7 ct/kWh, and annual operating costs are about 1-2 percent of the investment cost. Low running costs are one reason why most of the lifetime cost of a plant is fixed at construction.
The challenge is shifting energy in time. Fraunhofer ISE reports that large-scale battery storage capacity grew from 25.4 to 29.3 GWh in the first half of 2026, but it still describes a significant storage gap for moving surplus midday power to evening hours. Batteries, demand response and stronger transmission links all address the same problem from different directions.
These pressures are shared across neighbouring countries. Alpine markets face similar rooftop growth and grid questions, as described in the page on solar energy in austria.
Operating plants face their own side of the transition. As more output is curtailed or limited in negative-price hours, monitoring, forecasting and inverter control become central to plant performance, and availability and yield data are used to decide when and how much to feed in.
Frequently asked questions
How much solar capacity does Germany have?
Show answer
The Bundesnetzagentur reported that installed solar capacity totalled 117 GW at the end of 2025, after additions of 16.4 GW during the year.
What is Germany’s solar target for 2030?
Show answer
The statutory target is 215 GW by 2030. The regulator calculates that an average of 19.6 GW per year would have to be added to reach it.
Do new solar systems still get a feed-in payment at negative prices?
Show answer
No. Under the 2025 reform, new photovoltaic systems no longer receive the state-supported feed-in payment during negative prices, and this also covers smaller systems.
What share of electricity does solar provide?
Show answer
In 2025, photovoltaics covered 17 percent of gross inland electricity consumption.
Are plug-in balcony systems a large part of the market?
Show answer
They are a small part. The regulator puts plug-in systems at about 3.2% of new capacity in 2025, though they are very numerous.